
PERSONAL EXPERIMENT
DayDrift
Life visualisation experiment
Why
Small recurring activities are easy to underestimate when they are viewed one day at a time.
Question
What changes when you can see your daily habits as a whole year?
What I Built
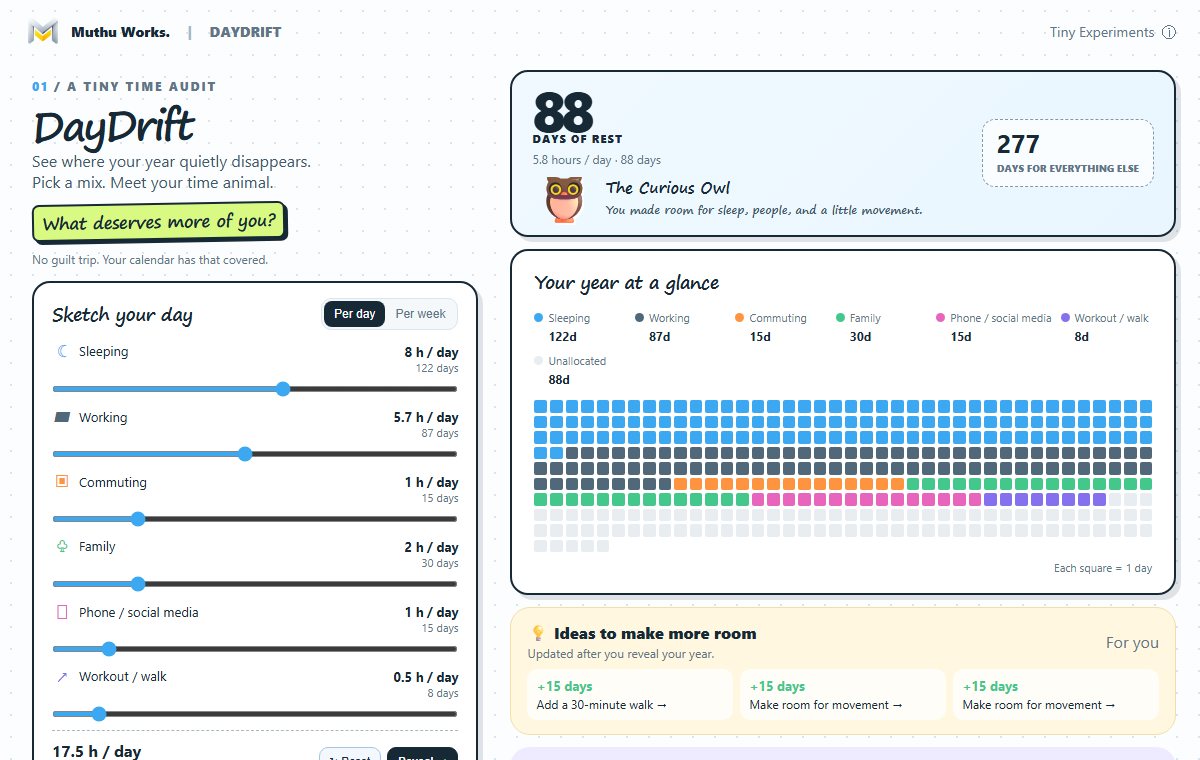
An interactive reflection tool with activity sliders and a year-at-a-glance map.
What I Explored
Intentional planning, simple controls, visual feedback and a playful tone that invites reflection without guilt.
What I Learned
The visual connection between an input and its consequence can make an abstract trade-off easier to understand.
OPEN TO A THOUGHTFUL CONVERSATION
Complex problem?
Let’s make it clearer.
ideas → clarity → impact.